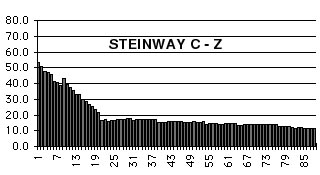
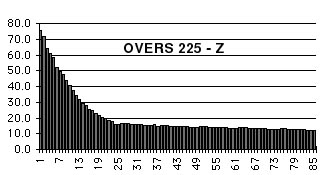
The following charts contain information on two piano scales, the Overs 225 (225 cm), and the Steinway model C (226 cm). The total string tensions are; 17,600 kg for the Overs and 18,250 kg for the Steinway. Please note that total string tension alone will tell us very little about a piano scale. While it is common for technicians to categorise certain pianos as having high or low tension scales, it is the distribution of tension which is a more important indicator of scale design characteristics. The two instruments being compared here illustrate this point. While the Steinway C has the higher overall tension (Stein C - 18.2 ton, Overs 225 - 17.6 ton), the Overs has a very much higher tension at note A1 (OS225 - 178 Kg, Stein C - 120 Kg), whereas at note G#24 the Stein C has 70.5 kg (31 % brk) while the Overs 225 has 74.2 Kg (36 % brk).
These graphs have been converted to jpeg images from two string scale speadsheets (from the author's collection of over sixty string scales), the Overs 225 No. 003 and a Steinway Hamburg model C produced around 1980. Please note that the figures shown for the Overs bass sections will not be as uniform as depicted in the graphs (although they will follow quite closely to the indicated figures), since these graphs were taken from the original design sheet where the copper wrap diameters were idealised to achieve the smoothest possible bass scale. When the actual strings are wound, there will be variations in the mass per unit length figures for the copper wrap, which will cause the scale figures to deviate slightly from the idealised form. The idealised scale specifications are supplied to our local bass string maker (Lou Parke), who selects the appropriate wrap diameters to follow, as close as possible, to the idealised scale dimensions which we have supplied. The treble plain wires will not vary in this way, since the speaking lengths can be set to within 1 mm for the longer speaking lengths G#24 (154.0 cm at 36%), and to within 0.5 mm for speaking length C88 (5.3 cm) and since the plain wire diameter (mass per unit length) is known.
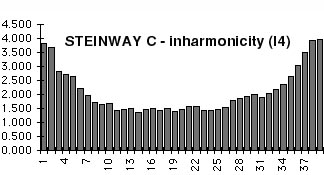
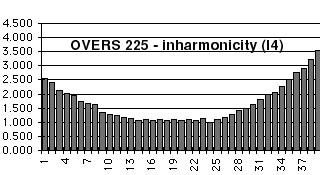
The Overs scale has approximately the same deviation of the % breaking strain for the plain wire sections as for a Steinway D string scale, where % break falls to around 36 % at the lowest note on the long bridge (which is F21 at 183 cm speaking length for the D, and G#24 at 154 cm for the Overs 225). For the model C, % break falls sharply towards the lowest note on the long bridge F21 (156.1 cm at 26%). The greater the deviation in % break across the compass of the instrument (all other things being equal), the greater will be the tuning instability in response to temperature and relative humidity changes. Analysis of a number of scales from various pianos in the early 1980's (with pocket calculator) lead the author to a realisation of the link between deviation of the percentage of breaking strain and tuning stability.
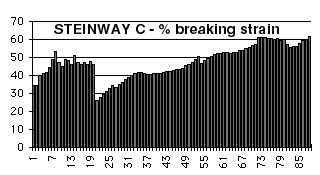
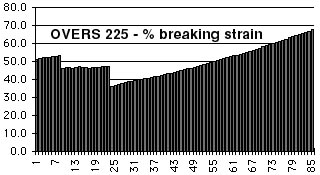
In the Overs chart, you will observe a tension increase at the treble/bass break, and for the transition from bichords to singles, although the % increase is even more pronounced in the Stein C scale. It is not possible to design a scale with uniform trends in % brk, Inharmonicity and Z (impedance) simultaneously. I have chosen to allow deviation in % brk across the bass/treble break to facilitate a more uniform transition for the other two variables. Nevertheless, it is still possible to design a scale in such a way that the tension step at string breaks is minimised. When referring to the above charts, it can be seen that the 225 scale has a deviation of approx. 10% at the treble/bass transition, while that of the model C is nearly 20%.
Similarly, a tension increase is necessary at the first single string to prevent the first single from being relatively weak when compared to the last bichord note (check out the Z charts to observe this trend between these two scales). For pianos which do not have an increase designed into the bichord/single transition, a listening test will confirm that there is a relative lack of "tonal fullness" at the first single. For the model C 'Z chart', you will see that there is a noticeable increase in Z at the first bichord (which in the case of the model C scale, is directly attributable to the relatively low tension at F21), and a fall in Z at the first single. This fall in Z is typical where there is no increase in % break at the first single string. relative to the last bichord.